Okay time for a bit more data analysis, as that's my idea of fun. Don't read this if you go to sleep quickly.
I've been using this map a lot, as the data is up to date and it offers temporal data by country and region.
https://hgis.uw.edu/virus/
The global data is now starting to show some interesting patterns, particularly in the countries that are in a more advanced stage of the outbreak.
So let's take a look at S-Curve's (sigmoid function). They look like this:

In the beginning you see steady growth, then exponential growth, then decelerating growth, then the growth rate slows as it tails off into logarithmic growth and eventually a flat line.
Currently all of the provinces of China and South Korea are in the logarithmic stage or flat line (the flat part at the top). Here's an example from Goungdong in China:
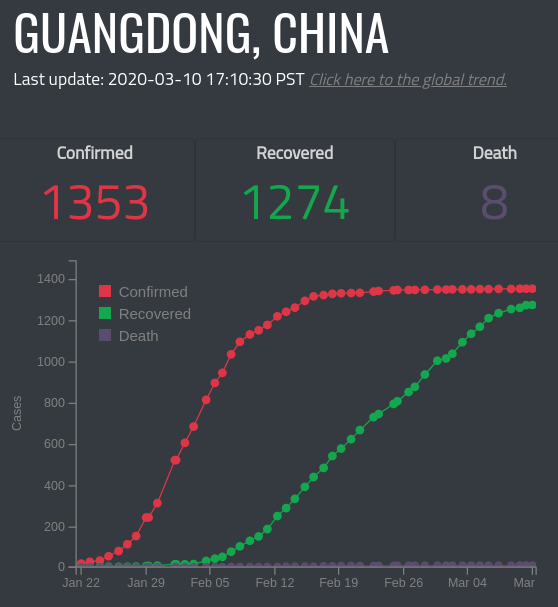
At the moment it seems that containment measures such as case tracing work while recorded cases only increase in double digit jumps, in such cases you will see steady growth rather than exponential growth.
Thailand is a good example of this:

The number to keep an eye on in the coming weeks it how quickly countries move from the exponential stage (accelerated growth of cases) to the logarithmic stage (decelerated growth of cases).
In most places in China it took between 14 and 21 days. While South Korea did it in roughly 14 days and Italy (if the current trend continues) will take a similar amount of time.
Most of the rest of Western Europe appears to have passed the containment phase (steady growth) and is moving into the exponential phase.
Things to look out for:
- Can countries remain at the containment phase indefinitely (Singapore, Hong Kong, Thailand etc) or is the exponential phase inevitable?
- Will the long tail at the top of the S-Curve hold or will there be a second wave once strict measures are lifted? (watch Korea and China)
- Will there be any countries that can't flatten out a pattern of exponential growth?